
Data processing/analysis, machine learning
As two avid League of Legends players, finding out that AP itemization was being reworked was a bit of a surprise. Would our favorite AP mage champions still be strong? How would these changes affect the champion spectrum? With these questions in mind, we set out to analyze and display the data handed to us with a single hope in mind: that AP is OP.
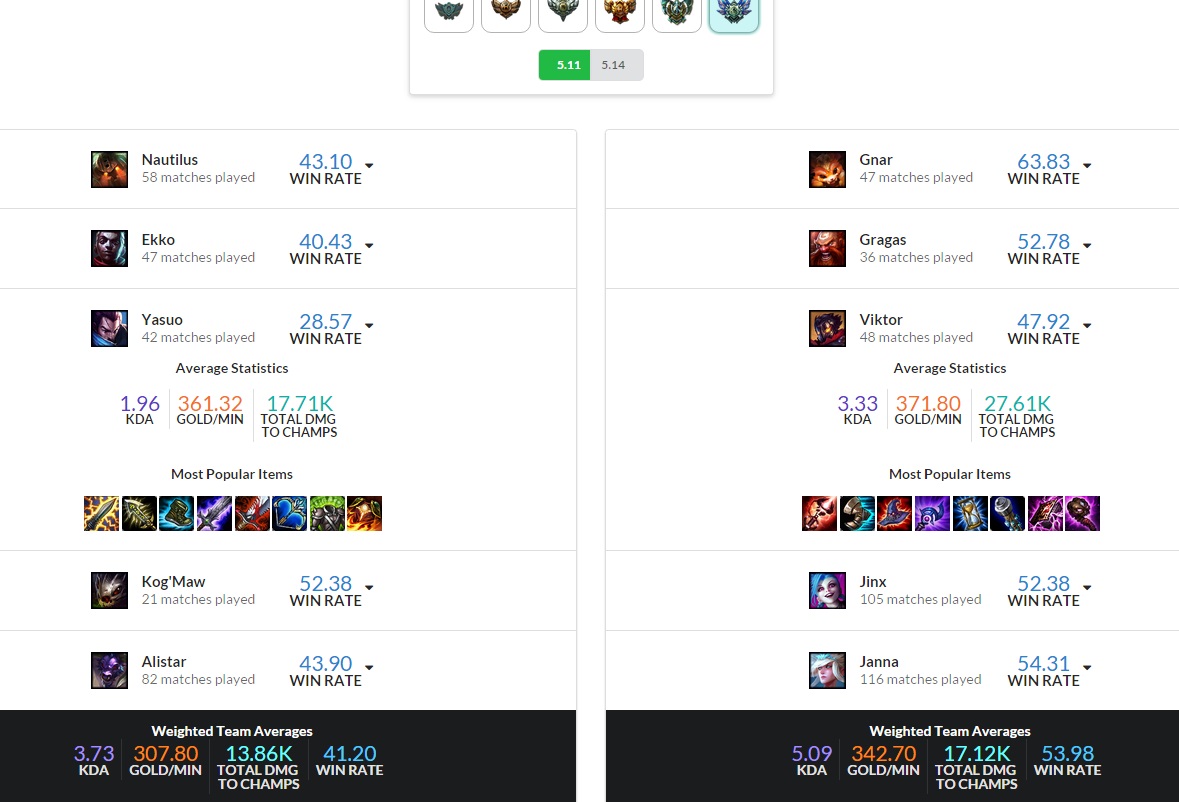
Purpose: We initially set out to display statistics about how each champion fared between patches 5.11 and 5.14, as well as their varying data between different match rankings, from unranked normal matches to each tier in ranked. We also wanted to highlight the most popular items built on each champion and their average time built. This data is displayed in a 5x5 team format.
Methodology: To gather all the data we wanted to display, we wrote a variety of Python scripts to perform different tasks for us, located in ApIsOp/scripts. The first of these, RiotAPI.py is a wrapper built directly around the Riot API using Python library requests, allowing us to make generic requests to the API. From there, we created a number of scripts to download and sort the data. Finally, the most important script here is generateChampionData.py, which took all the sorted data and produced JSON data files for each champion with different fields for both patches and all match tiers. Additionally, we created also a number of static data files, containing either static data from the Riot API or various mappings we wanted to produce (as well as one documenting all the AP item changes).
Since this user interface allows users to query in a 5v5 format, we wanted to provide team-related statistics on top of individual champion statistics. Instead of a simple average across champions on each team, we decided on a weighted average to avoid biases from low sample sizes; since the match count of each champion in each patch or tier varies so greatly, it would be a rather large bias to have, for example, a 80% win rate (abnormally high compared to average) gathered from 5 matches skew the average win rate for the rest of the team that may have more than 1000 matches counted.
To create a visual format for this data, we used a combination of HTML, CSS, and JavaScript with various libraries, most prominently Semantic UI.
Findings of interest: Notably, our dataset was not spread evenly across match tiers. While we were given 10k matches from each queue type in each patch, the distribution of these 10k across ranked matches is very uneven, with Silver having about 40% of the data, and Diamond, Master, and Challenger combined only having about 4%. Thus, we chose to combine the higher tiers into Diamond+ to give it a bit more weight. Yet still, we have very few matches for various champions in Diamond+, for example Zilean only had 2 matches in 5.11 and 3 matches in 5.14.
Additionally, a few champions did not have any data in patch 5.11. Tahm Kench had no data, as expected. However, both Caitlyn and Jayce also had no data for this patch. Both of these champions were disabled for a duration of the patch and thus, the dataset simply did not have any matches with them. (All three do have 5.14 data, however).
Kayle is a bit of an exceptional data point in our findings. In patch 5.11, all of her popular items in all tiers of play indicate that she is mostly played in a laning role, sometimes as support. With the release of Sated Devourer in 5.13, the jungling metagame shifted, bringing Kayle back into a jungle role. Between 5.11 and 5.14, she went from 0 to 3 jungle items in her most popular items (when many other popular junglers still only had 1 or 2), employing Skirmisher's Sabre, Ranger's Trailblazer, and also Stalker's Blade, all with the Sated Devourer enchantment.
Interestingly, Ezreal has a Luden's Echo in patch 5.14 on some of the lower tiers. This is not present in 5.11 or elsewhere. This is likely because of the release of the Runeglaive jungle enchantent in patch 5.12 and its subsequence changes in patches 5.13 and 5.14. After its release, mid-lane AP Ezreal with Runeglaive became very popular until the 5.14 change. People still building Luden's Echo in 5.14 may have neglected to read the patch notes or tried to use an older build.
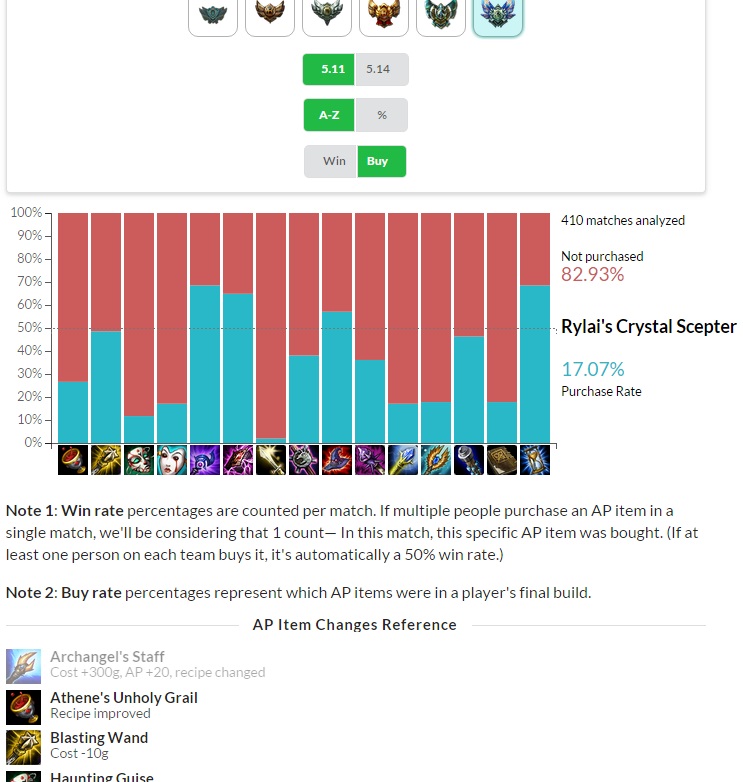
Purpose: Displaying champion statistics and their associated item statistics does not give us a direct view onto the data specifically for the changed AP items. To handle this, we decided to display an item-specific graph showing win rate (how many matches was it won with out of how many matches was it bought?) and buy rate (out of total matches in a tier, how many times was it bought?)
Methodology: To generate all of the data across changed AP items, we used a script similar to the one for generating champion data called generateItemData.py. This produced a JSON data file for each item which we then aggregated into a single CSV file.
For visualizing this data, we used D3.js, a JavaScript library for producing data vizualizations.
Findings of interest: The win rates for individual items is generally not overwhelming, the highest being at about 70% in Diamond+ for Rylai's Crystal Scepter and Rabadon's Deathcap (depending on patch), but for the most part, items generally sit approximately at a little above 50%. This is likely because popularly built AP items have a high chance of being on both teams, which would then be considered a 50% win rate in that match. Of much more interest is the actual changes in which items have the highest percentages and how they change across tiers and patches. In general, in terms of win rate, it looks as if items across the board generally had a more balanced spread, meaning that there was less of a disparity between the "strongest" and "weakest" items, especially so in our normal non-ranked matches, which has the largest amount of match data.
As for buy rates, only four specific items sat just above 50% across all ranks in 5.11: Luden's Echo, Rabadon's Deathcap, Zhonya's Hourglass, and Morellonomicon, where Luden's Echo ranked highest in popularity at 73.96% purchase rate at its peak. By comparison, the least popular (full) item was Will of Ancients at 10.07%. The 5.14 patch seems to have increased AP item purchase diversity, where items at the extreme highs and lows were slightly normalized.
In particular, it looks like the AP item with generally the highest win rate is Rabadon's Deathcap. If it wasn't the highest win rate, it was at least a very strong contender. This is likely because players are more inclined to build offensively (and thus get the most AP) when ahead, and build defensively (Zhonya's Hourglass, etc.) when behind—and being ahead early leads to a higher chance of winning. Rabadon's Deathcap's large flat AP and % bonus AP also synergizes well with many items.
While initially fearing that the AP item changes would have been a large nerf, it doesn't appear that way after examining our data. Rather, the it doesn't seem as if the changes can be explicitly called a "buff" or "nerf"—simply, they're just changes that created a shift in itemization possibilities, allowing different item synergies and playstyles. There are many factors that need to be taken into consideration when discussing the impact of such a large number of item changes at once, and it's not easy to make a simple judgment. Yet, it's still clear that AP is still strong, and champions that wield it can find their place in many team comps.
While we've taken care to consider all the elements that go into processing the data set, there are a variety of factors that may indicate that the data is not necessarily able to suffice as the "purest" form of an AP item change analysis. For example, we are examining data from patches 5.11 and 5.14, and the changes were released in 5.13. Within these patches there were also a large number of other changes introduced that heavily affected the entire champion spectrum and possibly the affect of AP items as well. Notably, Sated Devourer was released, causing huge shifts in the metagame. Not every single change has been analyzed in-depth (and to do so would be a daunting task).
To make processing the data easier and what we considered to be more meaningful, we combined several data points. We ignored all boot enchantments and only considered second-tier boots. Additionally, in the most popular items for each champion, we limited the output to only having one pair of boots. For example, it wouldn't be that interesting to see ADCs with both Homeguard and Furor boots in their most popular items, or tanks deciding between Ninja Tabi or Mercury's Treads. We'd rather see another core item. However, we left in multiple jungle items (and enchantments) as these show meaningful early game choices (especially with the addition of Sated Devourer).
We combined the mana stacked items, Seraph's Embrace and Muramana, into their unstacked counterparts, Archangel's Staff and Manamune. We tracked the buy time as the unstacked version, but always tracked the end data point as the stacked version, since the main difference between them is simply time, and we didn't want to show both a stacked and unstacked version on the most popular items.
All popular items are taken from a player's end-game build. Additionally, any non-full item components in their list are only considered if the most popular items do not contain and item that builds out of it. For example, if B. F. Sword happens to be one of the most popular items on Caitlyn, it won't show if Infinity Edge or The Bloodthirster are already in the list. However, something like Quicksilver Sash may show if the fully-built Mercurial Scimitar is not that popular.
There were some anomalies in the given data set. For example, sometimes in the event timeline of a match, the event of a player buying a certain item simply does not exist. We decided the most likely case was buying an item right as the match ended, most likely during a surrender. It's not uncommon for players to try to buy items at the end of a match, as they want their fullest build to appear in their match history. So for these data points, we set the buy time to the end of the match.
Not all data is created equal. Or at least, the distribution of matches is not equal, and as mentioned before, we have only a small number of matches in certain tiers or on certain champions. Additionally, we only downloaded matches from NA, as downloading match data from all regions would have been very time consuming, though most of our actual scripts actually have the functionality for all regions. And lastly, from each patch we are only processing a given 10k matches, which is only representative of a portion of matches from the entire patch.
 Thresh
 Malphite
 Morgana
 Hecarim
 Urgot
Urgot
 Miss Fortune